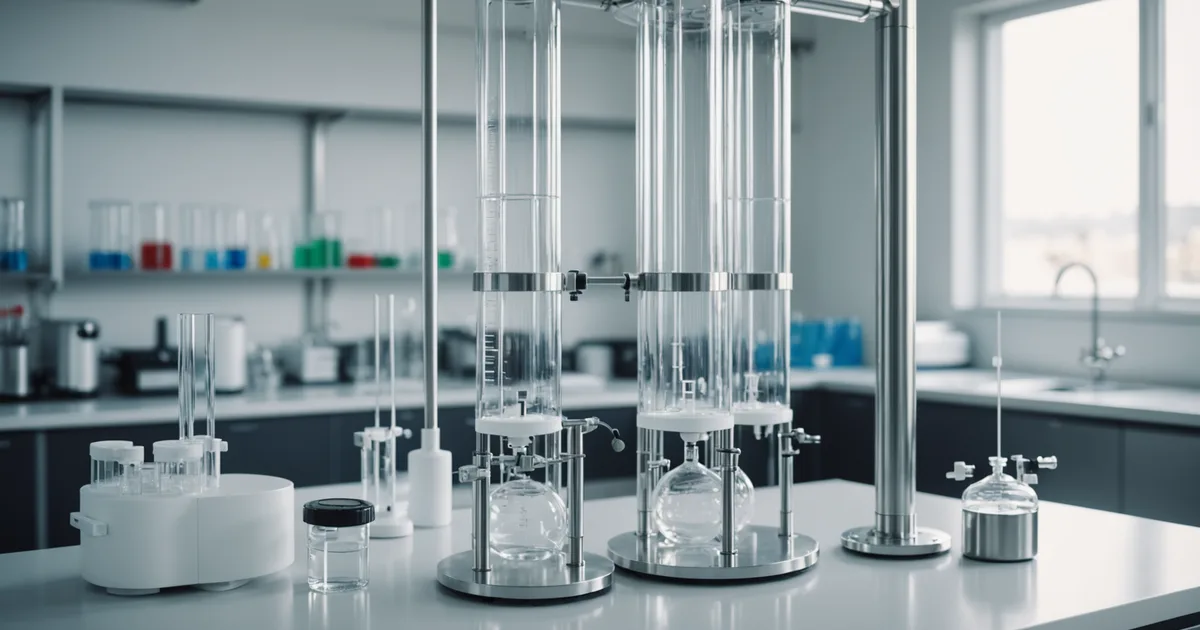
We started building the optimization feedback loop about eight months into our pilot production program, when we had enough batch data to see patterns in what was driving variation in protein purity. Before that, we were adjusting chromatography parameters manually based on batch results: looking at the HPLC profile from the previous run, identifying what looked like it could be pushed, and making conservative changes. This worked to a point, but the parameter space is not small and manual iteration is slow when you are running batches weeks apart.
This is an account of how we built the loop, what worked and what did not in the first three months, and where it has landed us in terms of production performance. The technical details are specific to our process, but the approach is transferable to any batch-to-batch bioprocess where you have a defined quality output, a measurable set of process inputs, and the time resolution to run sequential batches as experiments.
What we were trying to optimize
The target output is the purity of BC-1 (beta-Casein fraction) as measured by HPLC at the end of downstream purification. The relevant impurities are primarily other secreted proteins from the mammary epithelial cells (including other casein variants and whey fractions), residual media components, and host cell protein contamination from the cell culture. The purification train consists of tangential flow filtration for initial clarification and concentration, followed by ion exchange chromatography for the main purification step, and a final polish step.
The process parameters that influence purity are distributed across both upstream (cell culture) and downstream (purification) stages. We decided at the outset to build separate but linked optimization models for the two stages rather than treating the full process as a single black box, for two reasons: the two stages have different parameter types and different data cadences, and attributing a purity result to a specific stage failure is important for process troubleshooting.
The upstream component: media composition and its effects on purity
In the cell culture phase, media composition affects which proteins the cells secrete and in what proportions. Prolactin concentration and the hydrocortisone-to-EGF ratio influence the relative expression of different casein and whey fractions. If the upstream composition is drifting toward conditions that stimulate relative overexpression of alpha-Casein or kappa-Casein compared to beta-Casein, the chromatography step faces a harder separation problem regardless of how well it is optimized.
We characterized this relationship by analyzing the composition of the harvest conditioned media by HPLC before it entered the purification train. This gave us a "harvest purity score" representing the fraction of total secreted protein attributable to BC-1 at the point of harvest. Tracking this upstream purity score allowed us to decouple upstream composition effects from downstream purification performance in our modeling.
In the first three months, we found that prolactin addition timing and the glucose feeding schedule in the late secretion phase both correlated with harvest purity score variation across batches. We added these as controlled variables in the upstream optimization component.
The downstream component: chromatography parameter optimization
Ion exchange chromatography optimization for a multicomponent protein mixture involves a number of interacting parameters: the equilibration buffer composition (pH and ionic strength), the load volume relative to column capacity, the elution gradient slope and length, and the fraction collection window. Adjusting any one of these affects separation efficiency, but the interactions are nonlinear and not fully predictable from theory for a complex cell-culture harvest matrix.
The optimization model for this stage treats each batch's chromatography run as a sequential experiment. The inputs are the parameter settings used and the measured outputs (purity at collection, yield in the collection window, and the UV trace shape that characterizes separation quality). The model uses Gaussian process regression to build a probabilistic map of how parameter combinations affect the output, and proposes the next batch's parameters based on expected improvement under uncertainty.
What this is not: it is not a physics-based chromatography model and it does not predict separation performance from first principles. It learns empirically from your specific process. This means it required approximately 6 batches before the recommendations started to be meaningfully better than our manual starting point, and the first few batches run under model guidance showed more variance than later batches as the uncertainty region in the model was still wide.
What the first three months actually looked like
Months 1 and 2 were primarily data collection and model calibration. We instrumented the chromatography runs more extensively than before (more inline UV sampling points, fraction collection at finer cut intervals for the first few batches to characterize the separation profile), ran a deliberate fractional factorial design across three key parameters to give the model baseline variation data, and set up the data pipeline that connects batch record data to the model inputs.
Month 3 was the first period where the model was operating with enough data to make recommendations that were meaningfully outside our manual intuition zone. The most notable recommendation was a change to the elution gradient slope in the main beta-Casein elution step: the model consistently suggested a shallower, longer gradient than our standard protocol. We ran three batches with the modified gradient and purity in the primary collection fraction improved from our baseline average of 91.2% to 93.8% HPLC, with a corresponding reduction in the beta-Casein in the side fractions (which represents recoverable but lower-grade material that requires a second purification pass).
A flatter gradient takes longer, which has a cost in column occupancy time and throughput. The model was optimizing for purity, not for throughput. We had to adjust our objective function to add a throughput component, which modestly pulled the recommendation back toward a faster gradient. The model does what you ask it to optimize, not what you meant to ask, and defining the objective function carefully is most of the real design work.
Where this sits after the first batch series
The purification optimization component has contributed to the overall protein purity improvement across our 12 pilot batches. The purity improvement from our initial baseline to batch 12 is not entirely attributable to the model, because we also made deliberate protocol changes based on process understanding that the model prompted us to think about differently. Separating "what the model contributed" from "what we learned from looking at the model's recommendations" is not possible in retrospect, and probably not the right framing anyway.
The practical result is a purification process that reliably delivers above 93% HPLC purity with batch CV below 3%, which is the specification threshold we need for food-grade formulation partners to evaluate the ingredient in a meaningful way. Getting there took most of a year and more manual iteration in the middle than we expected.
We are skeptical of framings that treat optimization models as a shortcut to process development. They are a tool for making systematic learning faster, and they work well for that purpose. They require real process data, real understanding of what you are trying to optimize, and patience with the early batches when the model is still uncertain. For a batch-to-batch process like ours, the return on that investment is real but it arrives over months, not weeks.