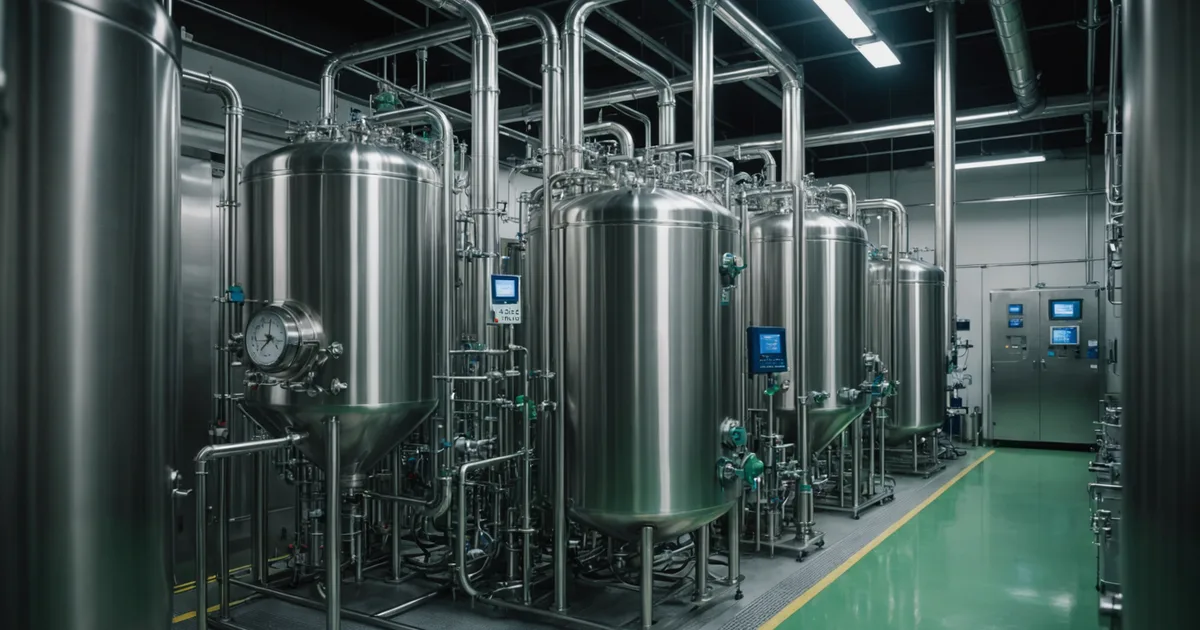
Twelve production pilot batches in a 200 L bioreactor. Each one taught us something the previous one did not. Some lessons were anticipated from literature and process engineering principles; others were genuinely unexpected and cost us time, material, and in one case a partial batch. This is a summary of what changed between batch 1 and batch 12, organized by theme.
We write these down not to perform transparency but because the cell-ag field has too little literature on what actually happens at production scale in food-grade mammary cell culture. Most published work stops at flask or small bioreactor stage. The leap to 200 L involves process engineering decisions that cannot be read out of a scientific paper, and documenting our experience is useful to others navigating the same transition.
Lessons 1 through 3: the media and feeding strategy
Our initial media formulation was derived from academic literature on bovine mammary epithelial cell culture, optimized for secretion studies at flask scale. The composition included insulin, transferrin, bovine prolactin (to stimulate lactogenic differentiation), hydrocortisone, and EGF in a basal DMEM/F12 medium. This worked at flask scale. In the 200 L bioreactor, the first batch showed normal growth to peak cell density but depressed casein secretion rates in the production phase.
Lesson 1: prolactin activity in a bioreactor degrades faster than in a flask incubator. The more active mixing, higher surface area of media exposed to vessel walls, and the presence of dissolved oxygen fluctuations all accelerate protein degradation. We moved to more frequent prolactin additions and changed to a batch addition at a 48-hour interval rather than the single addition at seeding that had worked in flasks.
Lesson 2: glucose depletion events that are minor nuisances in small culture become significant in a production run. A 6-hour window where glucose drops below 3 mM during the secretion phase, which can happen if a feeding pump fails or a scheduled addition is delayed by a shift change, causes a measurable drop in casein secretion that does not fully recover for 18 to 24 hours after glucose is restored. We added redundant glucose monitoring and automated feeding triggers rather than relying on scheduled manual additions.
Lesson 3: the spent media composition that feeds into our AI optimization model was more variable in early batches than expected, partly because we were not sampling consistently enough to capture the full metabolic profile. We moved to automated metabolite sampling at 4-hour intervals using an at-line analyzer, which made the optimization data considerably cleaner.
Lessons 4 through 6: bioreactor engineering and control
Lesson 4: our initial impeller speed for mixing was set based on published guidelines for minimum oxygen transfer in mammalian cell bioreactors. It was too aggressive for our cell line. Viability at harvest in the first three batches averaged 84%, compared to 93% in flask cultures. The cause was shear-induced cell damage from the impeller. We reduced impeller tip speed by approximately 25%, which required compensatory changes to our gas transfer strategy to maintain adequate dissolved oxygen.
Lesson 5: foam formation in the production phase caused intermittent sensor readings from our pH and DO probes. Foam accumulated on the probe tips and created signal dropout periods of up to 40 minutes during which pH control was operating on a stale reading. We added a mechanical antifoam addition protocol and replaced our original probe configuration with a design with better foam-tolerance mounting geometry.
Lesson 6: temperature uniformity across the bioreactor vessel was more variable than our single thermocouple reading indicated. When we placed additional temperature loggers at multiple vertical positions in batch 7, we found a 1.8 degree Celsius gradient from the jacket-cooled bottom to the headspace region. For most mammalian cell lines this would be negligible. For bovine mammary epithelial cells in a temperature-sensitive secretion phase, this gradient was likely contributing to variation in the upper region of the culture. We modified our circulation strategy to improve mixing at the vessel edges.
Lessons 7 through 9: downstream processing integration
Lesson 7: the harvest step, clarification of the conditioned media to remove cell debris before purification, was our most variable unit operation in early batches. Centrifuge speed calibration drift between batches affected the clarification efficiency. Batches where clarification was suboptimal showed higher turbidity entering the chromatography step and lower final purity. We tightened our centrifuge maintenance interval and added a turbidity acceptance criterion at the end of clarification that must pass before the sample proceeds to purification.
Lesson 8: we underestimated how much protein was being lost in the membrane filtration step prior to chromatography. In batches 1 through 5, we were using a 0.2 micron filtration membrane that was rated for bioburden reduction. Fouling of that membrane with lipid-containing cell debris was retaining a meaningful fraction of the target protein. Switching to a 0.45 micron prefilter upstream of the 0.2 micron membrane reduced protein loss by approximately 18% in subsequent batches with no detectable impact on bioburden.
Lesson 9: ion exchange chromatography column lifetime was shorter than our initial estimate. We planned for 50 cycles per column based on supplier literature for standard protein applications. In practice, the lipid and media component content of our harvest required more aggressive cleaning-in-place protocols that degraded the resin faster. We revised our column replacement schedule to 30 cycles and validated that purity performance was consistent across a full column lifetime at that cycle number.
Lessons 10 through 12: documentation, specification, and quality
Lesson 10: batch record completeness affects your ability to learn from bad batches. In the first four batches, our batch records were adequate for production use but did not capture enough granular data to support root cause analysis when something went wrong. When batch 5 showed an anomalous protein yield, it took three days of investigation to identify the probable cause (a media component lot variation), partly because we did not have comprehensive enough documentation of which lots were used at which steps. We expanded our batch record format significantly after that.
Lesson 11: defining "out of specification" requires deciding what your specification actually is, which requires data from enough batches to characterize your production distribution. We could not meaningfully define OOS acceptance criteria until we had run at least 8 batches. Before that, we were using tentative limits that we adjusted as we learned more. This is normal for an early-stage production program but it means your earliest specification documents should be dated and versioned, not presented as if they are final.
Lesson 12: food manufacturer procurement teams ask different questions than academic collaborators about your production data. By batch 10, we had consolidated our quality documentation into a format that addresses the specific questions a food-grade ingredient buyer needs answered: consecutive-batch consistency data, cleaning and sanitation records, raw material traceability, and a batch disposition log showing how you handle batches that do not meet specification. Building that documentation structure early rather than retrofitting it to historical batch data would have saved us several weeks of work when we began our early-access formulation program.